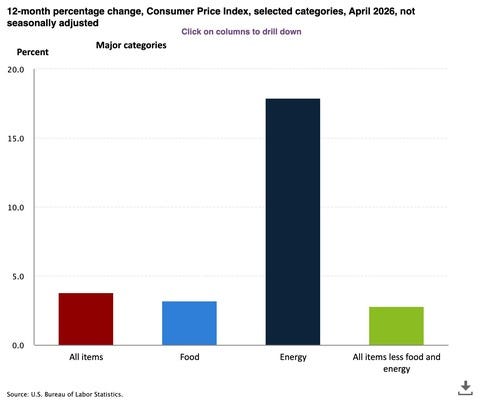
The Number That Lies to Your Face Every Month & a Soda Trend Born in Utah Rewrites the CategoryLast week’s report found that the CPI rose 0.6% in April, pushing annual inflation to 3.8%, the highest level in three years.
The CPI is supposed to tell us what food actually costs. It doesn’t.Every month, the Bureau of Labor Statistics releases its Consumer Price Index report, and every month, Washington holds it up like a report card. Inflation is up. Inflation is down. Food prices eased. Americans should feel better. Or worse. Or somewhere in between. But what really annoys me is the thing nobody in the briefing room is saying out loud: the CPI, as it measures food, is broken. Yes, broken and misleading. It’s been broken in a way that consistently lets the food industry off the hook and leaves shoppers wondering why their grocery bill keeps climbing even when the headlines say it shouldn’t. The reason is shrinkflation — and the CPI is structurally designed to miss most of it.
The Measurement That Isn’t Measuring What You Think It IsHere is the fundamental flaw: the CPI tracks the price of a package, not the price of what’s inside it. When your favorite brand of orange juice drops from 64 ounces to 52 ounces and keeps the same shelf price, the CPI, in theory, is supposed to catch that. In practice, it often doesn’t — or catches it too late, too inconsistently, and with a methodology that smooths away the consumer reality. The BLS will tell you, and has told me, that its field data collectors are trained to notice size changes and flag them for economist review. A size adjustment is then supposed to be applied so that the price increase per unit is captured. The process sounds reassuring. The reality is far more complicated.
Think about how many SKUs are on a typical grocery store shelf — thirty-plus thousands of items across a single store, hundreds of thousands across the food system. BLS field collectors visit a rotating sample of retailers on a monthly or bimonthly schedule. They are checking specific items in specific locations. When Manufacturer X quietly reduces the net weight of a cracker box from 12 ounces to 10.5 ounces, there is no alarm that goes off. There is no automatic feed from UPC scanners to BLS economists. There is a human being, on a scheduled visit, hoping to notice that a package they last saw two months ago is now slightly smaller. A change the manufacturer typically has deliberately designed to be imperceptible to consumers; and most often to the BLS field collectors. What The Research Actually ShowsIn July 2025, the Government Accountability Office released what is now the most comprehensive U.S. government study of shrinkflation to date: GAO-25-107451. The headline finding was that shrinkflation contributed less than 0.1 percentage point to the 34.5% total CPI increase from 2019 to 2024. But just read past the headline and we find something very different. The GAO’s own data showed that shrinkflation contributed 3.0 percentage points to paper products inflation and 2.5 percentage points to snack food inflation over that same period. The average per-unit price increase from downsizing ranged from 11.6% in paper towels to a staggering 32.4% in coffee. These are price increases that landed directly on American families without ever showing up clearly in what politicians and central bankers use to tell us how we’re doing. And that’s the official government data with all of its acknowledged limitations. The academic research is even more sobering. A study by economists Christian Rojas of UMass Amherst, Edward Jaenicke of Penn State University, and Elina T. Page of the USDA Economic Research Service — published in the International Journal of Industrial Organization — found that official food inflation was understated by nearly 4 percentage points between 2012 and 2019, precisely because standard price index methodology was measuring price per package rather than price per ounce or serving. Over that seven-year span, the average size of packaged food fell by 14.6%. Consumers were paying the same or more for meaningfully less food, and the official inflation number didn’t fully see it. The study also surfaced a finding that should give every retailer pause: shrinkage was most pronounced among products purchased by higher-income households and in states without unit pricing laws. To me that means that the absence of transparency regulation directly correlates with more aggressive downsizing.
THE ROBIN REPORT Retail Fraud: A Detective Noir Crime StoryThe city never sleeps, and neither does the con. I’m no Philip Marlowe but I’ve been working the grocery beat for more than 30 years. I’ve walked every aisle, shaken hands with every brand manager from Bentonville to Dubai and watched the supply chain twist itself into knots that would make a sailor blush. It’s old-fashioned true crime that shows up as shocking greed. Read my latest column HERE The Gatorade Test CaseWant a perfect example of how this works in the real world and how the CPI can miss it? Look no further than Gatorade. In 2022 PepsiCo quietly phased out its standard 32-ounce Gatorade bottle and replaced it with a 28-ounce bottle at the same price. That is a 12.5% reduction in product for the same number of dollars at the register, or mathematically, the equivalent of a 14.3% price increase per ounce. The company’s official explanation? The new bottle is more aerodynamic and easier to grip. Now let’s think about this: when a BLS field collector visited the store shelf where that Gatorade lived, on a rotating visit schedule, and saw a 28-ounce bottle where a 32-ounce used to be (which coincidently is the exact same height) — was that adjustment captured in the CPI immediately? Consistently? Across every market? The answer is: sometimes, partially, and with a lag. Gatorade is not an outlier. The same playbook has been run on Wheat Thins family size boxes (two ounces lighter, 28 fewer crackers), Chobani Flips yogurt (down from 5.3 ounces to 4.5 ounces), Kleenex small boxes (from 65 tissues to 60), Kellogg’s Corn Flakes family size went from 24 ounces to 18 ounces, and even our bathroom necessities felt the pinch as Angel Soft 12-pack mega rolls shrank from 429 sheets per roll to 320 sheets – that’s a 25.4% reduction and the largest documented shrink across household paper products. Each one a price increase wearing the disguise of a redesign. Why This Is More Than A Data ProblemThe CPI is not just an economic statistic. It is the mechanism by which the federal government calculates Social Security cost-of-living adjustments for approximately 70 million recipients. It is the benchmark the Federal Reserve uses to set interest rate policy. It is the figure cited in labor negotiations and used to index tax brackets. When the CPI understates what food actually costs because it fails to account for packages getting smaller, the downstream effects ripple across the entire economy. There is a reason consumer trust in official inflation statistics has fallen. It is not, as some claim, simply a matter of perception or media-driven anxiety. It is because the number does not match the experience. And in food, more than almost any other category, the experience is what matters. As long as the CPI is measuring price per package and not price per unit weight, the official inflation statistics will never fully capture what is actually happening to the consumer’s purchasing power in the grocery aisle. Even when the BLS catches a size reduction and makes a unit-price adjustment, the process can lag by months — months during which that higher effective price is flowing through checkout lanes millions of times a day, unrecorded by the index that is supposed to be tracking it. What Actually Needs To ChangeFirst, I’ll acknowledge what the BLS does get right: it is not ignoring shrinkflation, and the methodology does attempt to capture it. A field-collector-based system visiting a sample of stores on a rotating schedule was designed for a different era of retail. It was not designed for a food supply chain in which manufacturers routinely adjust package sizes across thousands of SKUs, often rolling changes out regionally before going national. The fix is not complicated in concept, even if it requires political will. The BLS should be incorporating scanner data — the same point-of-sale transaction data that retailers and CPG companies use internally — to track price per unit weight and price per item count in real time. That data exists. It flows through every checkout lane in America every single day. NielsenIQ and Circana have it. Grocery retailers have it. The CPG manufacturers have it. The only institution that isn’t fully using it to calculate the official inflation rate is the BLS. Mandatory unit pricing at shelf level would also help — not just for consumers making individual decisions, but for any measurement system trying to track what people are actually paying for food. According to NIST, 18 states and one territory have unit pricing laws or regulations in force. Of those, only 11 jurisdictions have mandatory unit pricing provisions: Connecticut, Maryland, Massachusetts, New Hampshire, New Jersey, New York, Oregon, Rhode Island, Vermont, Puerto Rico and the District of Columbia. Nine more jurisdictions have voluntary unit pricing provisions: Arkansas, Florida, Hawaii, Mississippi, Montana, Nevada, Virginia, West Virginia, and the U.S. Virgin Islands. The remaining 33 states have no unit pricing provisions at all. Mandatory unit pricing should be federal policy.
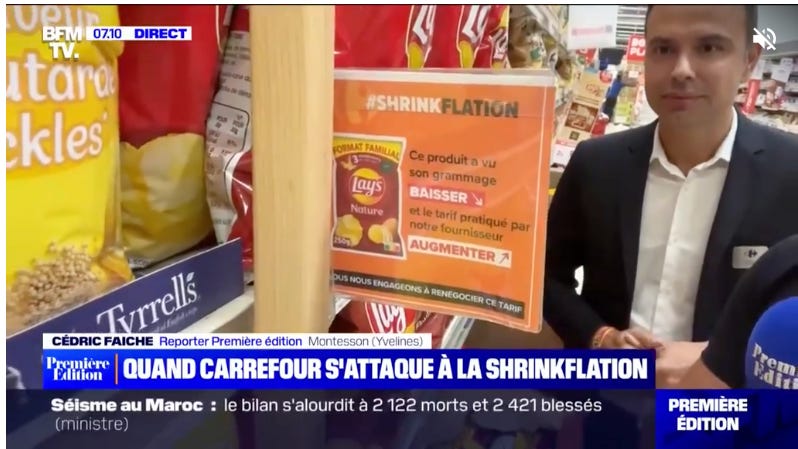
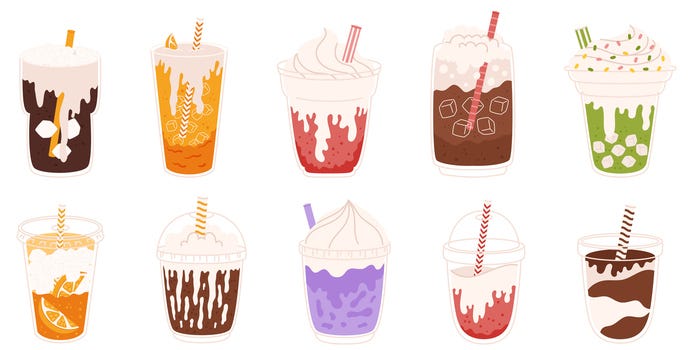
My Bottom LineWhen a shopper pays $6.49 for a box of cereal that’s now 12 ounces instead of 14, and the evening news tells them food inflation is slowing, the disconnect between data and experience breeds distrust… and it is the retailer who is standing between that shopper and the manufacturer who made the shrinkflation decision. Transparency is the antidote. Retailers who proactively communicate unit pricing, who call out when a product has been reformulated or downsized, who give shoppers the information they need to make real comparisons — those retailers are building the kind of trust that survives a tough economy. In 2023 Alexandre Bompard, CEO of Carrefour announced an anti-shrinkflation initiative in all Carrefour stores in France. Shelf signs were put up that read: “This product has seen its volume/weight fall and the effective price charged by the supplier rise.” Carrefour identified 26 products that had shrunk without a matching price reduction, from suppliers including Nestlé, PepsiCo, and Unilever. The grocery retailers who stay silent are leaving a void that erodes loyalty one shopping trip at a time. The CPI will keep being published every month. It will keep being cited in speeches and policy papers and Fed press conferences. But until it is redesigned to measure price per unit rather than price per package and it reflects the real transaction that happens at the checkout lane it will keep understating what American families are actually paying to put food on the table. And our shoppers already know it every time they are at the checkout. The Lempert Report Is Going Twice a WeekStarting June 1, The Lempert Report will publish twice a week — and the second edition is built for people who want to be a step ahead of the industry, not just catch up with it. Every Tuesday, you’ll continue to receive the newsletter you’ve come to expect — the news, the trends, the stories that are shaping what we eat, how we shop, and what the food industry needs to pay attention to. Free for everyone. Every Friday, paid subscribers will receive an exclusive second edition — a deeper, more analytical look at the issues and trends that matter most. Friday editions will go in more detail. Paid subscribers also participate in my quarterly LIVE Substack feeds. If you’re already a paid subscriber — thank you! Starting June 1, you’ll automatically receive both editions every week, no action needed. Getting Dirty: How a Utah Soda Shop Started a Beverage RevolutionThe dirty soda trend has moved from TikTok curiosity to supermarket aisle staple — and the food industry is scrambling to keep up.
I’ve been watching the grocery and beverage industry, and I can tell you that very few trends catch the big players flat-footed. The dirty soda craze is one of them. What started as a regional quirk in the desert communities of Utah — where members of The Church of Jesus Christ of Latter-day Saints, who abstain from alcohol, coffee, and hot tea, turned cold sodas into something of an art form — has quietly metastasized into one of the most disruptive consumer beverage movements in recent memory. And now, it’s coming to a supermarket aisle near you. From One Drive-Thru to a National PhenomenonThe story begins in 2010, when Nicole Robison and her then-husband Todd Tanner opened a single drive-thru soda window near Utah Tech University in St. George, Utah. They called it Swig, and the concept was simple: take a name-brand soda — your Coke, your Dr Pepper, your Sprite and “dirty” it up with flavored syrups, creams, fruit purees, and other add-ins. For $1, you could customize your drink and make it your own. Fifteen years later, Swig operates 164 locations across 16 states, with year-to-date revenues up 39% and same-store sales climbing more than 8%. Just this month, the chain inked a 25-unit franchise deal to expand across Southern Florida. The chain is now eyeing Charlotte, North Carolina, and pushing aggressively into Houston. By any measure, this is not a fad. This is a category that deserves a look from grocery retailers.
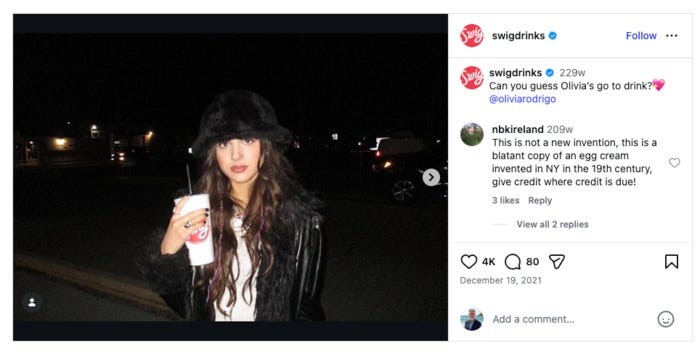
So, what created this national franchise blitz? Social media. In December 2021, pop singer Olivia Rodrigo posted a photo of herself holding a Swig cup on Instagram, and the brand went viral overnight. Then in 2024, the reality TV show The Secret Lives of Mormon Wives put Swig front and center and the floodgates opened. The chain’s first half of 2025 alone generated 191 million social media impressions, with most of that coming from user-generated content. 270% More Social Conversations — and Big Beverage Is ListeningThe Food Institute reports a 270% increase in social conversations around dirty soda in the past year alone. And the major beverage companies heard it loud and clear. PepsiCo moved first and fast. The company launched Pepsi Wild Cherry & Cream in 2025. Then, just last month — April 7, 2026 — Dirty Mountain Dew officially hit shelves nationwide in 20-oz. single bottles and 12-pack cans, alongside a Zero Sugar version. No syrup required. No custom recipe. Just Mountain Dew, “done dirty” with a smooth, creamy finish right out of the can. Also coming this summer: Mug Floats Vanilla Howler, a root beer and vanilla cream riff that leans directly into the float culture that dirty soda has always channeled. Keurig Dr Pepper isn’t sitting still either. Dr Pepper Creamy Coconut became the company’s most successful limited-time carbonated soft drink to date based on retail dollar sales. Katie Webb, Vice President of Innovation and Transformation for Keurig Dr Pepper, told CNBC that the trend is “a recruitment tool, bringing new users into the trademark” — drawing consumers back to the base brand long after the trend passes. And then there’s the wild card: Mike’s Hard Lemonade has entered the space with “Dirty Lemonade” — a non-carbonated, boosted take featuring hot honey, cherry spice, and coconut. It’s the first major alcoholic beverage brand to translate the dirty soda flavor system into RTD alcohol. Even Twizzlers has launched an edible straw designed specifically for dirty sodas. Seriously! The Retail OpportunityHere’s what makes dirty soda genuinely interesting from a retail strategy perspective. According to Datassential, 2.7% of U.S. eateries now offer a carbonated soft drink that includes cream or milk, up from 1.5% a decade ago. Taco Bell has gotten into the game. McDonald’s has pivoted to embrace customizable beverage culture. And Food Dive reports that consumers are increasingly adding creamers to their sodas at home seeking layered mouthfeels and flavor experiences that standard carbonated beverages simply can’t deliver on their own. Coffee-Mate has even released a limited-edition Dr Pepper Coconut Lime Dirty Soda creamer, hoping for category crossover potential. The timing matters. Soda consumption peaked at 15.3 billion gallons in 2004 and slid all the way to 11.87 billion gallons by 2024 — a two-decade decline driven by health concerns and an explosion of alternative beverages. But dirty soda, alongside the rise of prebiotic sodas like Poppi and Olipop, appears to be helping arrest that decline. Consumption ticked up slightly in 2025 for the first time in years. That’s not a coincidence. The Health Reality Check — And It’s ComplicatedI can’t write about dirty soda without addressing the elephant in the room — or more accurately, the sugar in the cup. A standard 12-ounce soda already delivers about 150 calories and 39 grams of sugar. Load it up with flavored syrups, coconut cream, and a topping, and you’re looking at 250 to 400 calories and 55 to 70 grams of sugar in a single drink. To put that in perspective, the American Heart Association recommends no more than 6 teaspoons — 25 grams — of added sugar per day for women, and 9 teaspoons — 36 grams — for men. A maxed-out dirty soda can blow past both of those limits before lunch. The American Heart Association data is sobering: the average U.S. adult already consumes 17 teaspoons of added sugar per day — nearly double the recommended limit — before reaching for a dirty soda. Amy Paulus, an obesity medicine nurse practitioner at Advocate Health Care, compares the category squarely to elaborate, sugar-filled coffee orders: “Like a venti caramel Frappuccino, dirty sodas are certainly a treat that should be enjoyed in moderation. Not only are these beverages high in calories, but they also contain added sugars and are high in saturated fat from the addition of cream.” Now here’s where it gets more complicated for a trend that’s attracting millions of consumers who may be trying to make smarter choices. None of this means dirty soda is a public health crisis. Enjoyed occasionally, it poses little more risk than any other indulgent treat. The smarter approach, which some brands are already beginning to explore, involves building lower-sugar, lower-fat versions that deliver the sensory experience (the layers, the creaminess, the customization) without the metabolic payload. Prebiotic sodas like Poppi and Olipop have already proven there’s a mass market for carbonated beverages that satisfy without gutting your nutritional goals. The dirty soda category would be wise to take notes. My Bottom LineIf you’re a supermarket operator reading this, the question isn’t whether dirty soda belongs in your store. Dirty Mountain Dew is already on your shelves. The question is whether you’re thinking about the full category ecosystem — not just the RTD cans, but the syrups, the creamers, the specialty ice, the branded straws, the branded cups. The Swig model succeeded because it made the experience feel like something. Your beverage aisle needs to make the experience feel like something too. And don’t forget about offering dirty sodas from your grocerant fountain! And remember what made the trend. Build social media content around the combinations that are trending in your region. And don’t ignore the health-conscious consumer be sure to stock the Zero Sugar options front and center and prepare your retail dietitians with the information they need to help shoppers who are asking the right questions about what’s actually in their cup. The dirty soda trend is not just a beverage story. It’s a story about what consumers want from their food and drink in 2026: novelty, personalization, and permission to indulge. The brands that understand that are already winning. The supermarkets that build the right experience around it will win too. You're currently a free subscriber to The Lempert Report. For the full experience, upgrade your subscription.
|
Tuesday, 19 May 2026
The Number That Lies to Your Face Every Month & a Soda Trend Born in Utah Rewrites the Category
Subscribe to:
Post Comments (Atom)
No comments:
Post a Comment